ShopFloorConnect production monitoring software has a powerful browser-based reporting feature that allows you to configure and generate reports on demand, or to set up schedules to automatically deliver pre-configured reports. The ShopFloorConnect Standard Reports are templates that can be configured to include data from a specified time period, also from specific machines, operators, part numbers (or other important parameters depending on machine type), and/or shift. The individual machine monitoring reports have a number of report-specific configurable parameters called "filters" that control the report content.
ShopFloorConnect production monitoring software includes the following machine downtime tracking and OEE report templates:
Downtime Summary
The Downtime Summary tracks reasons for downtime by machine. You have the option to include either a pie or Pareto chart, and sort the machine downtime reasons by number of occurrences or by duration.
The Downtime Summary has report filters that allow you to include only specified machine states, as well as the standard ShopFloorConnect report filters. This machine downtime tracking report can be set up to display one machine/graph per page, or to consolidate multiple machines into a single report.
Sample Machine Downtime Summary Report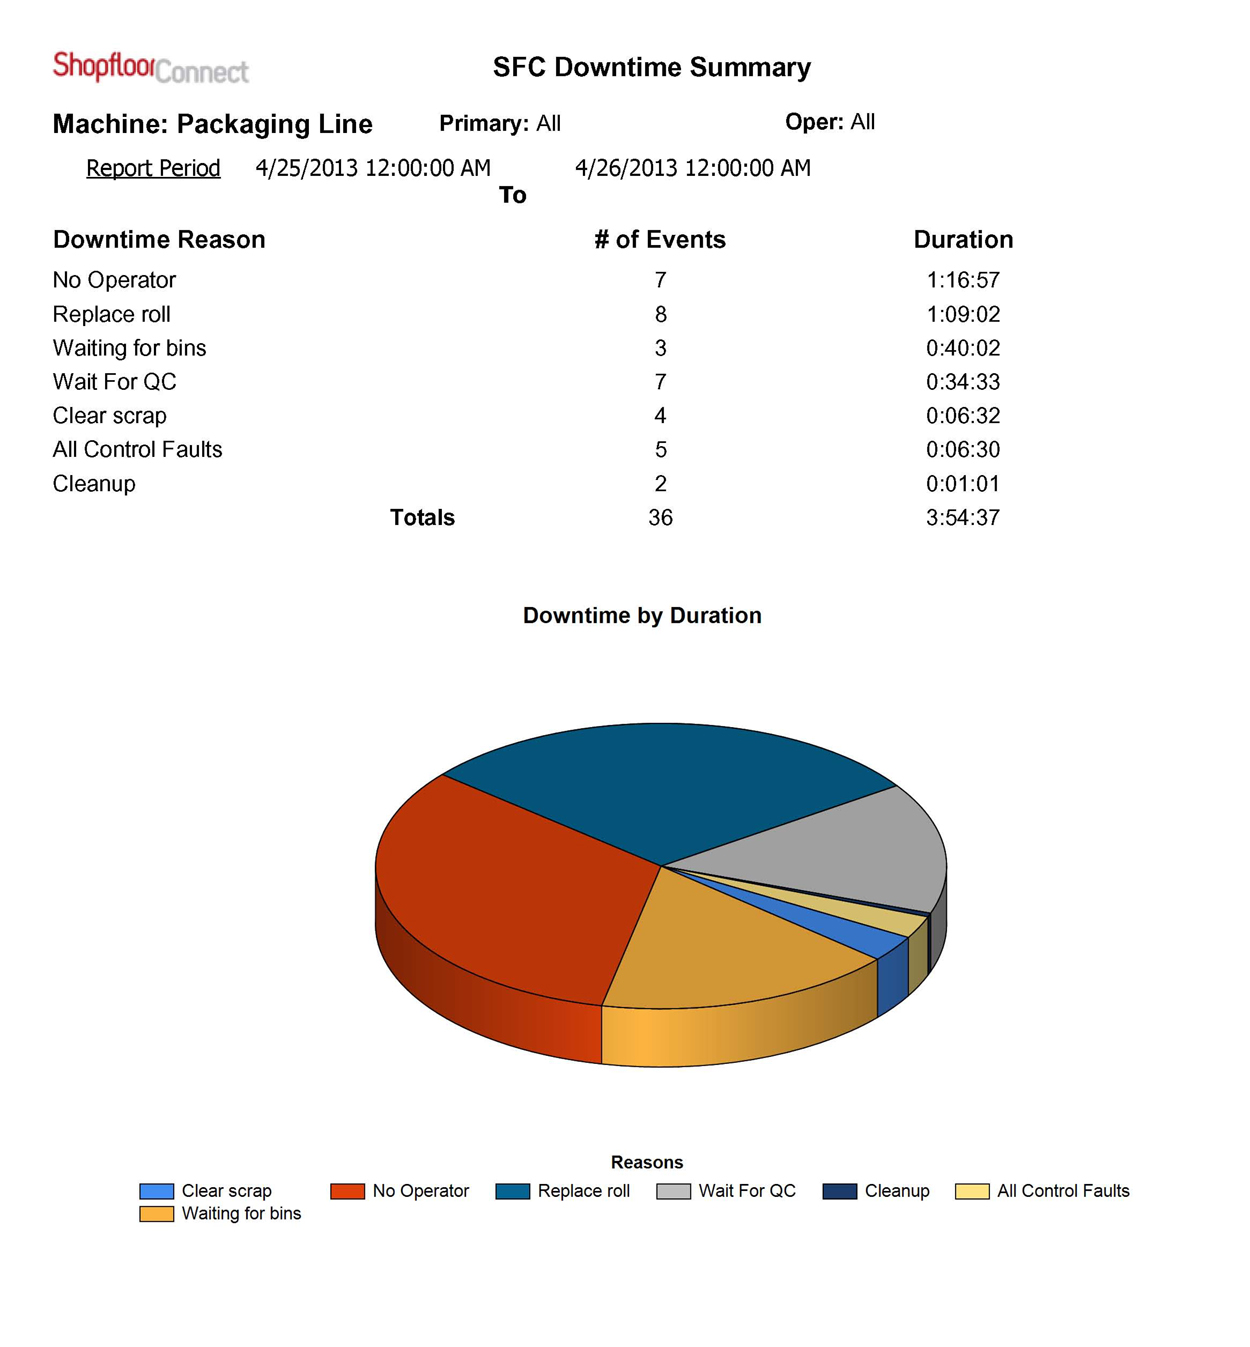
Downtime By Reason Report
The production monitoring software's Downtime By Reason Report contains a bar chart that shows the amount of machine downtime for selected downtime reasons across your machines. In addition to the standard report filters, the Downtime By Reason report has a multi-select filter to choose which machine downtime reasons appear in the graph.
Sample Downtime By Reason Report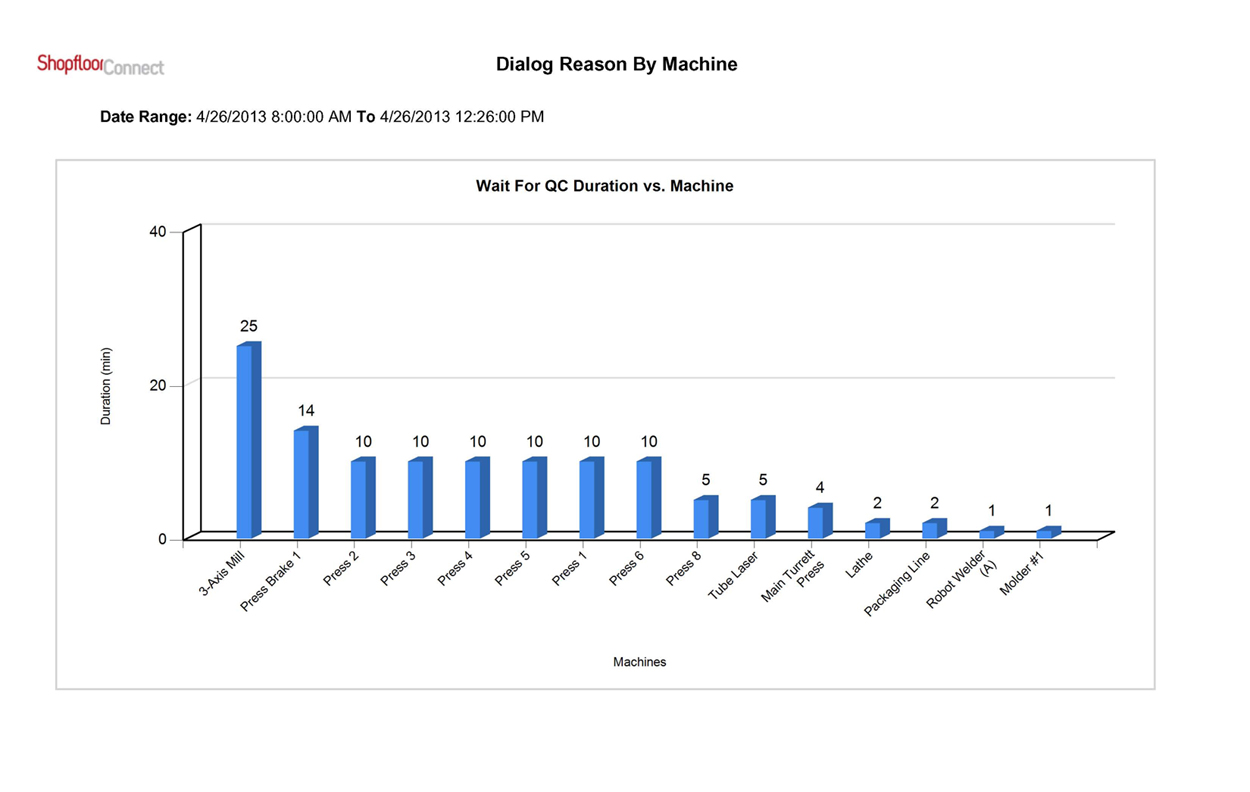
Tabular Uptime Efficiency Report
The Tabular Uptime Efficiency Report shows the uptime efficiency of the selected machines compared to the Standard Uptime Efficiency for each machine. If the machine meets or exceeds the standard, the table row background is green. If the machine is not meeting the standard, the background is red. This machine monitoring feature enables users to tell at a glance which machines are underperforming.
This report has machine and date range filters, as well as a setting to specify whether the table will be sorted alphabetically, by actual production efficiency, or by efficiency compared to the standard uptime (as shown in the example).
Sample Tabular Uptime Efficiency Report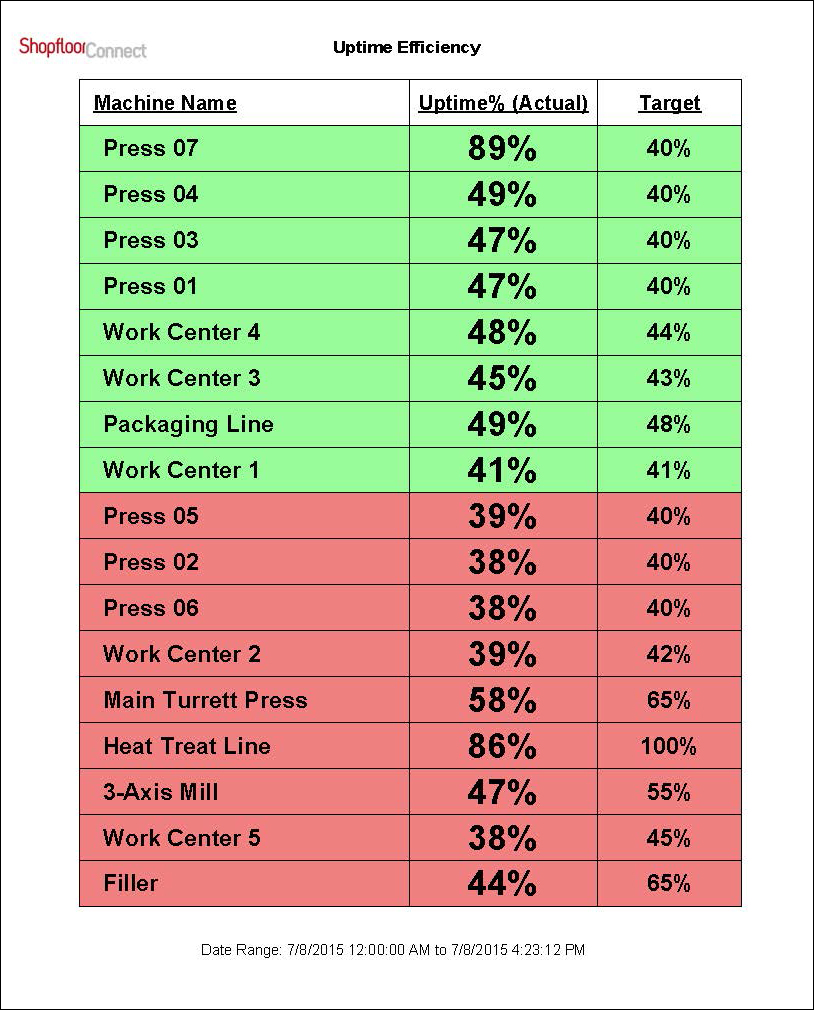
Production Summary Report
This tabular production efficiency report shows a line for each job run in each of the selected machines. There are fields for job start and end time, parts and scrap counts, (if applicable), as well as other information such as the amount of time spent in each of the machine states during the job.
The report features the standard ShopFloorConnect machine, date range, and delivery filters, filters, as well as a filter that allows you to either include or exclude partial jobs. Partial jobs are those that either started before or ended after the report period, with only a portion of the total job occurring during the report period.
Sample Production Summary Report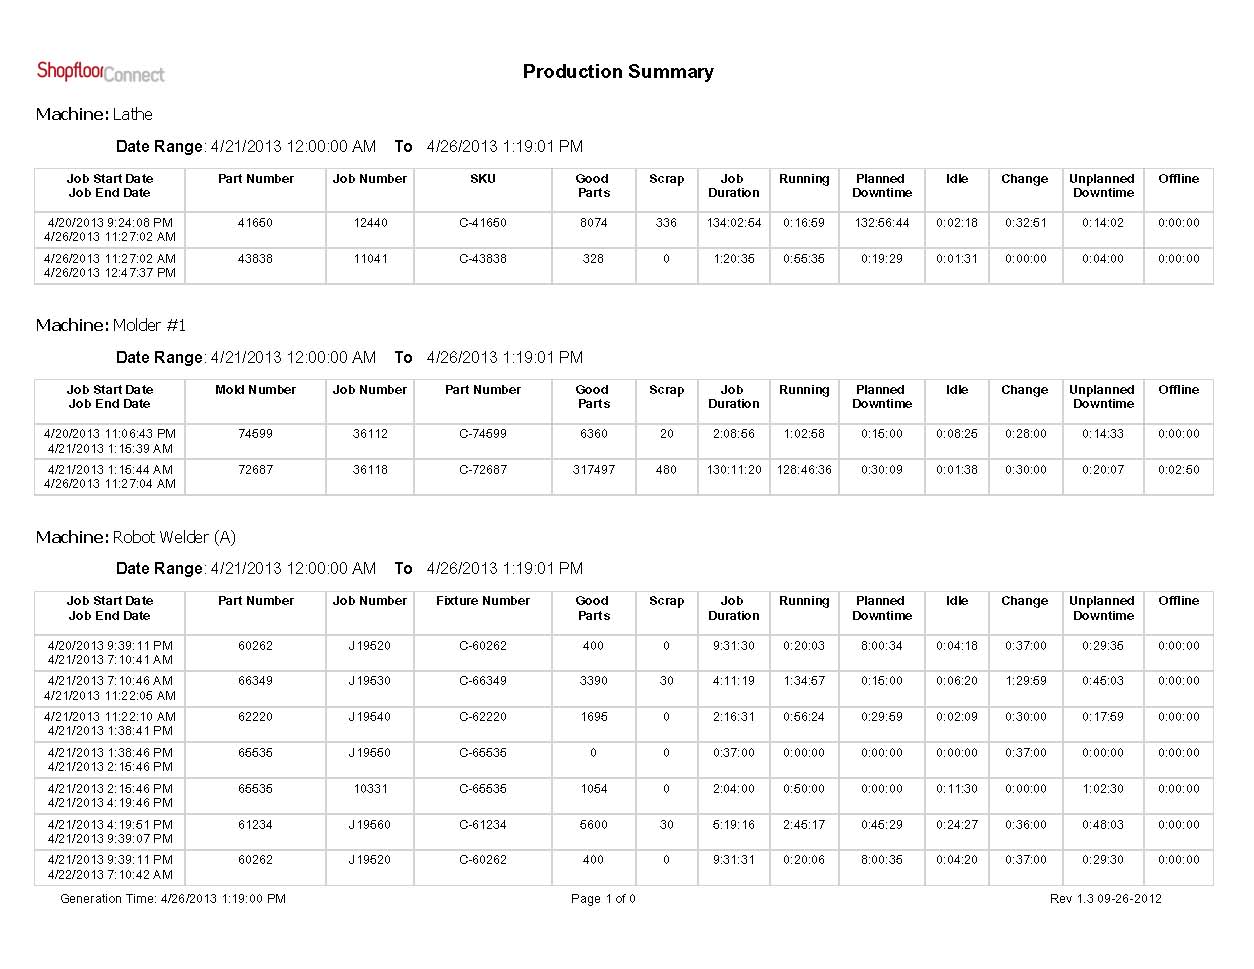
OEE By Machine (Form)
ShopFloorConnect production monitoring software also provides a detailed Overall Equipment Effectiveness (OEE) report for the selected machines, with one machine per page.
This OEE report features the standard ShopFloorConnect machine, delivery, and date range filters, as well as filters to allow you to include offline and or changeover time as either planned or unplanned machine downtime. There is a filter that allows you to include a summary either for the machines or for each shift.
This and all of the other ShopFloorConnect OEE reports have a unique feature - the ability to calculate OEE performance against a single "machine" ideal rate (the way that OEE is traditionally calculated), or by using ShopFloorConnect's revolutionary "OEE by Primary" concept, which allows you to specify a separate ideal performance rate for each part number (or other primary item) for each machine.
Sample OEE by Machine (Form) Report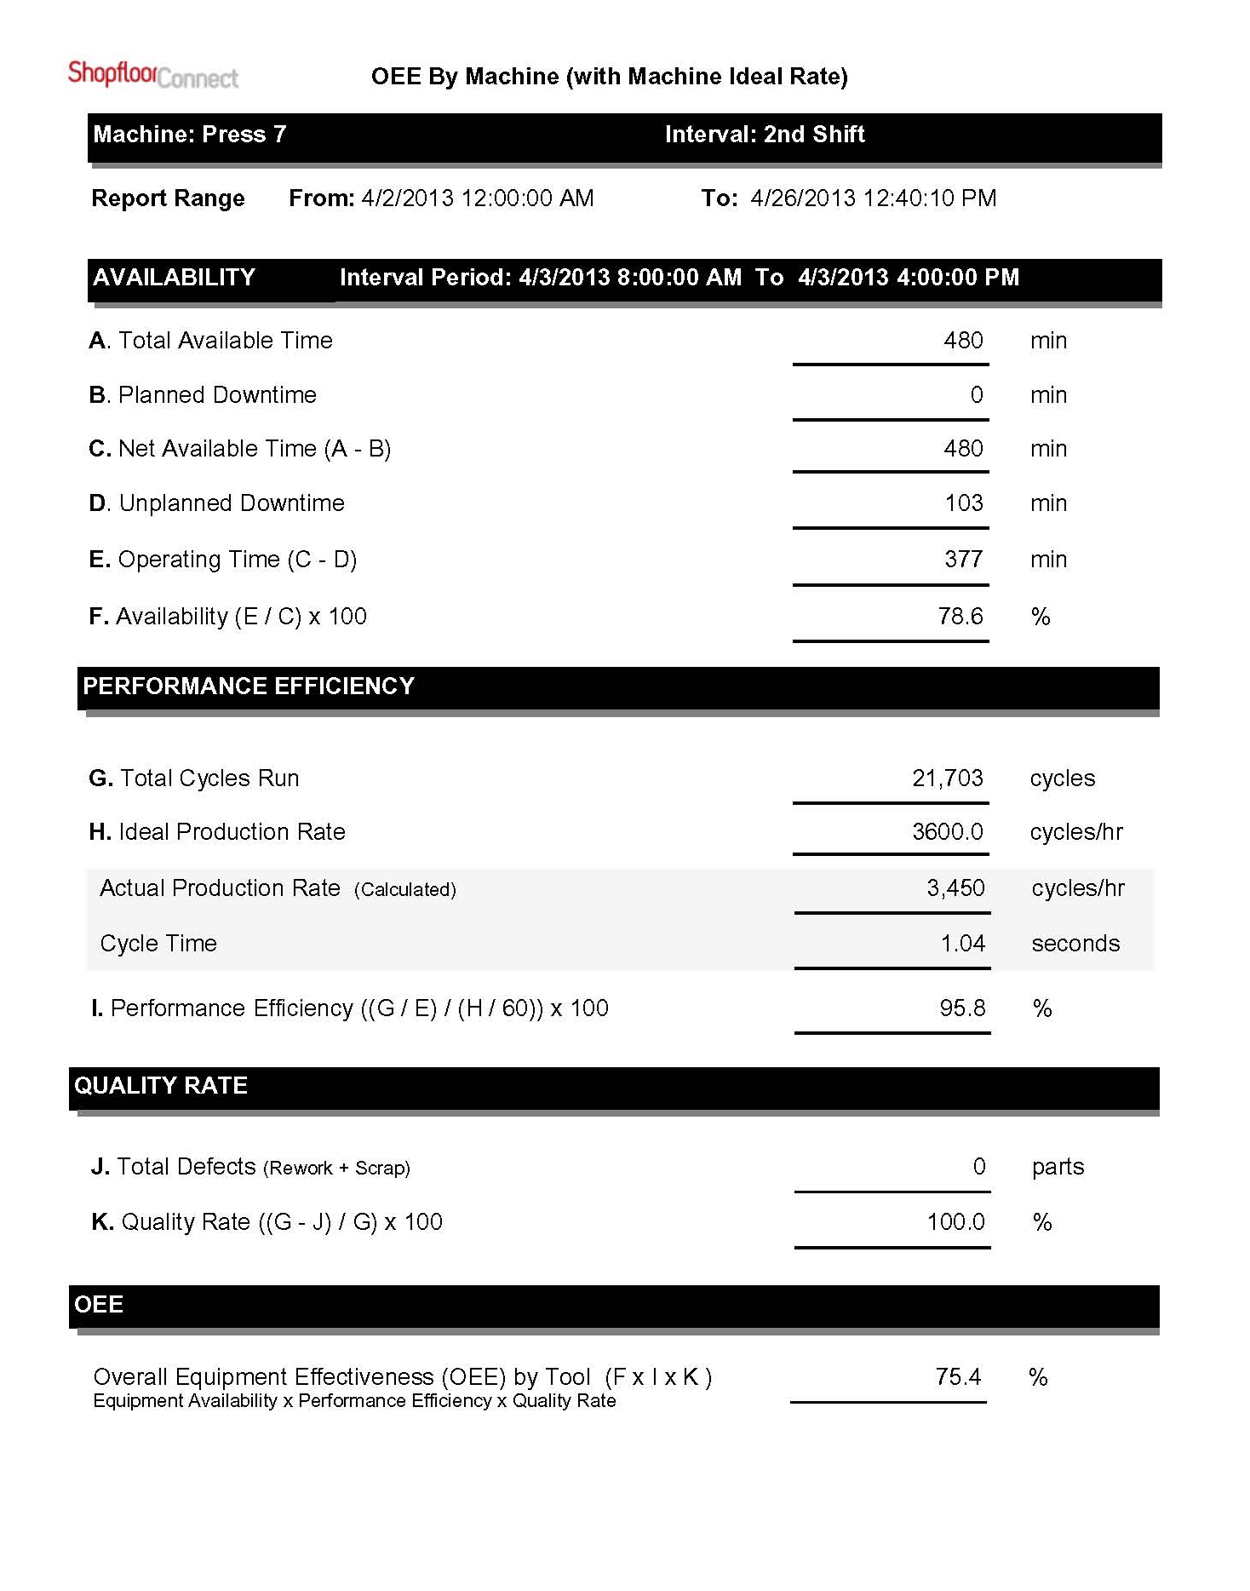
OEE By Machine (Graph)
This machine monitoring and downtime tracking software also provides a report that shows a bar chart with the Overall Equipment Effectiveness (OEE) for the selected machines over longer time periods
This production efficiency report features the standard ShopFloorConnect machine, delivery, and date range filters, as well as filters to allow you to include offline and or changeover time as either planned or unplanned machine downtime. There is a filter that allows you to include a summary either for the machines or for each shift.
All ShopFloorConnect OEE reports have a unique feature - the ability to calculate performance against a single "machine" ideal rate (the way that OEE is traditionally calculated), or by using ShopFloorConnect's revolutionary "OEE by Primary" concept, which allows you to specify a separate ideal performance rate for each part number (or other primary item) for each machine.
Sample OEE by Machine Graph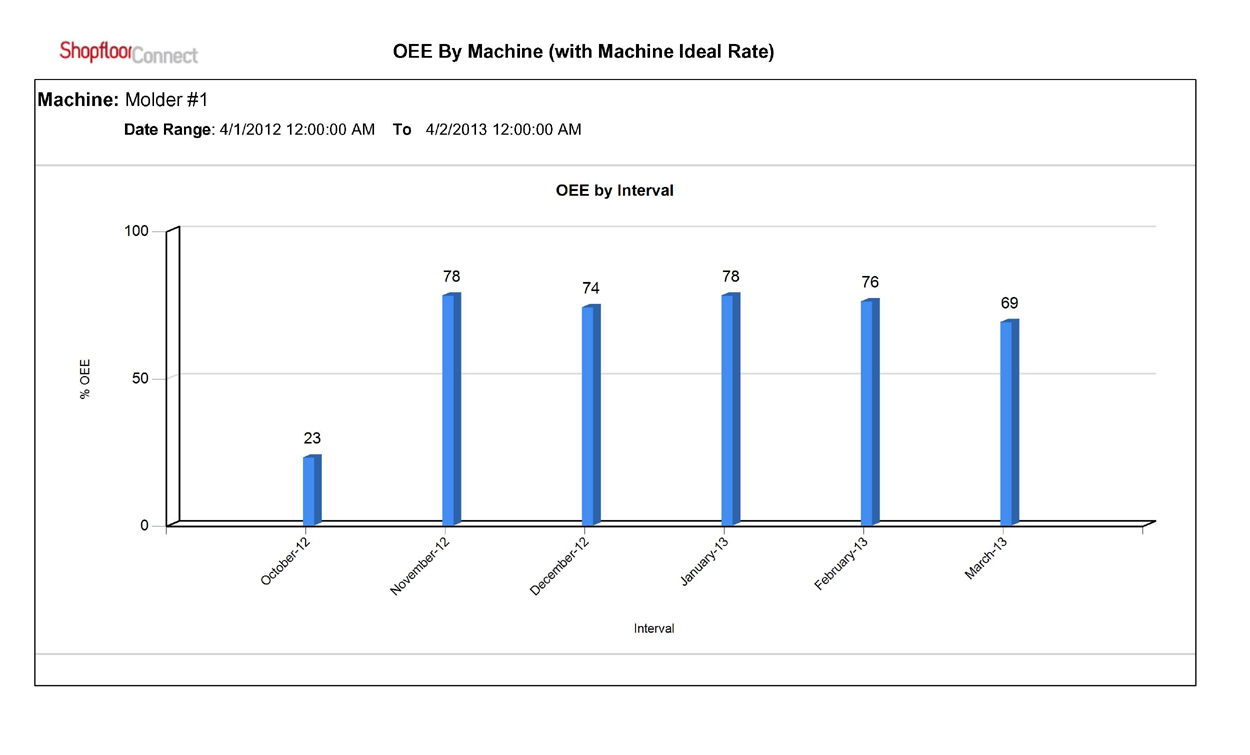
OEE By Machine (Tabular)
In addition to tracking information by machine, ShopFloorConnect production monitoring software allows you to specify an optional "Primary" item at run time. The Primary item might be the part number that the machine is making for that run, or the tool or mold number (for stamping presses or injection molding machines), that is being used by the machine for that job. The Primary item for each machine type must be predefined when ShopFloorConnect is initially configured. You can use the same primary item for all or many machine types (for example "Part Number"), or you can specify a different Primary item for each machine type.
The OEE by Primary Report allows you to create a report for the selected primary item only - regardless of which machine made or used it. This report calculates OEE based on each Primary item's Ideal rate (rather than the machine Ideal Rate).
This report features the standard ShopFloorConnect delivery, and date range filters, a filter to allow you to select the Primary Item, as well as filters to allow you to include offline and or changeover time as either planned or unplanned downtime.
Sample OEE by Machine Table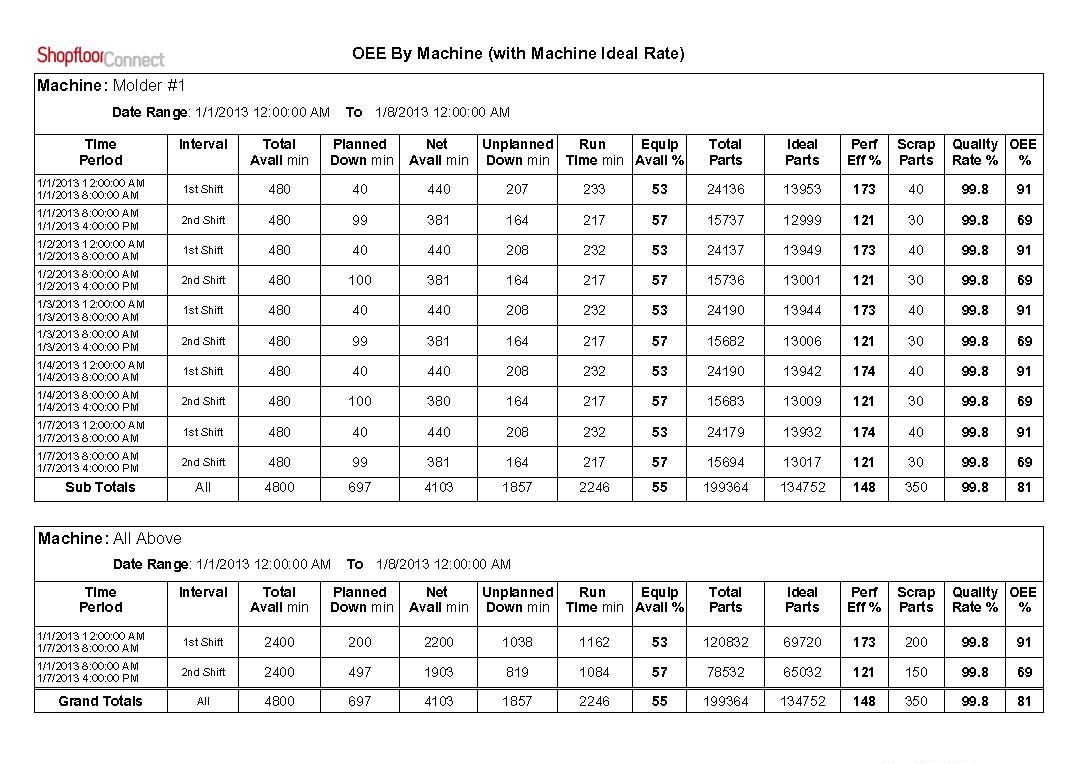
OEE By Primary
This machine monitoring software also features a report that shows machine OEE broken down by job in a tabular form. The report summarizes OEE by machine, and provides a total OEE for all machines in the report over the specified time period.
This report features the standard ShopFloorConnect machine, delivery, and date range filters, as well as filters to allow you to include offline and or changeover time as either planned or unplanned downtime. There is a filter that allows you to include a summary either for the machines or for each shift.
This report can use OEE calculations based on a single "machine" ideal rate (the way that OEE is traditionally calculated), or by using ShopFloorConnect's ability to apply different ideal performance rates by job ("OEE by Primary").
Sample OEE by Primary Report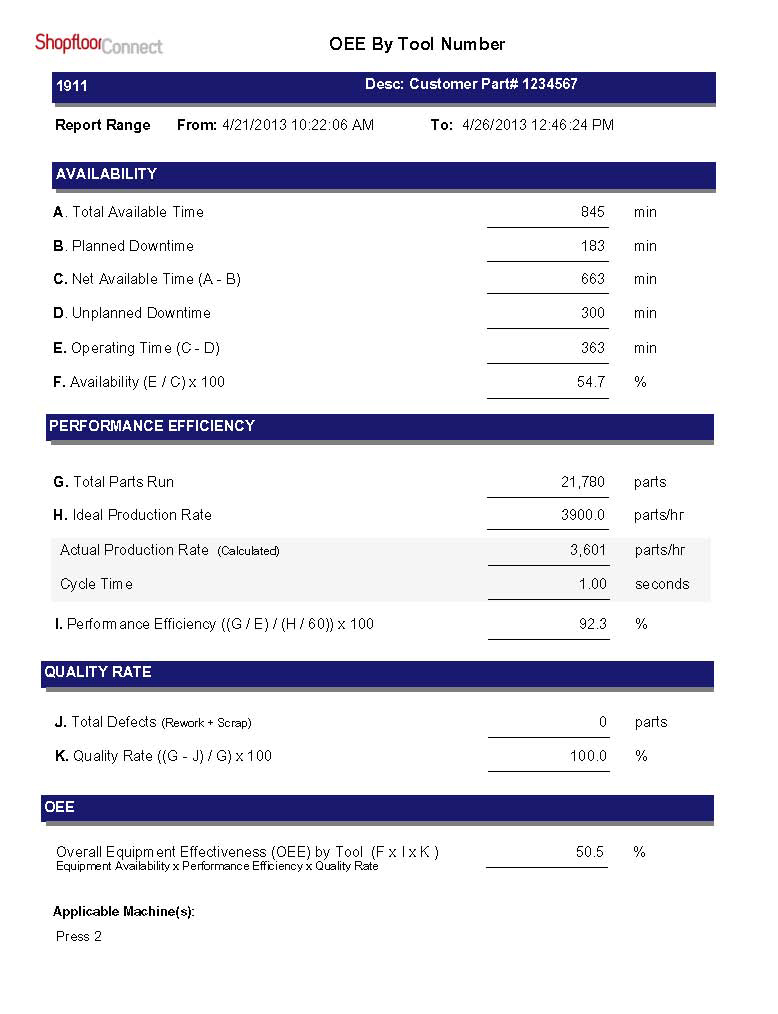
Operator Summary Report
The Operator Summary Report combines an Overall Equipment Effectiveness (OEE) report, a State Summary Report, and a Downtime Summary Report for the selected operator(s) over the selected time period.
The report features the standard ShopFloorConnect delivery, machine, and date range filters, as well as a filter to specify which operator(s) to include in the report.
Sample State Summary Report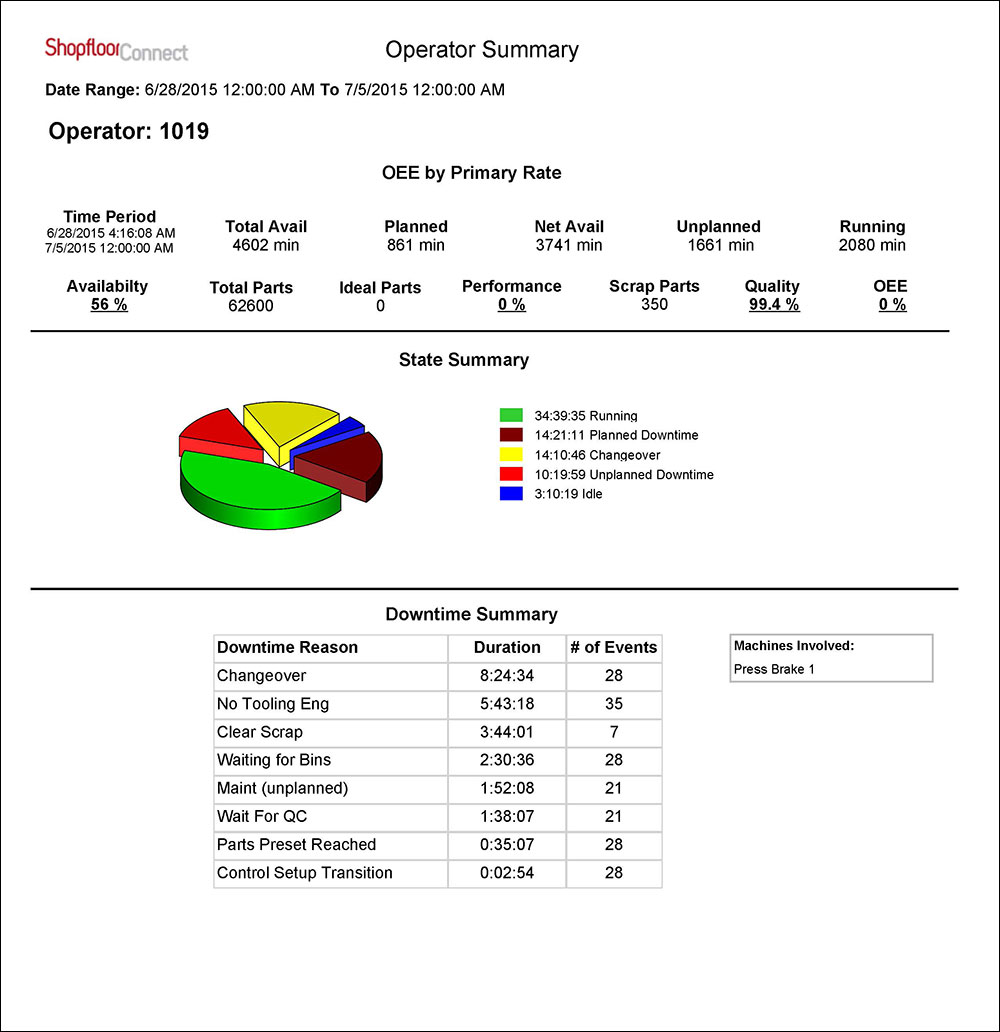
State Summary Report
The production monitoring software also provides a State Summary Report that generates pie charts and a table that shows the amount of time the selected machines have spent in each of the five machine states (running, idle, unplanned downtime, planned downtime, and changeover) over the selected time period.
The report features the standard ShopFloorConnect delivery, machine, and date range filters, as well as a filter to specify which shift(s) to include in the report.
Sample State Summary Report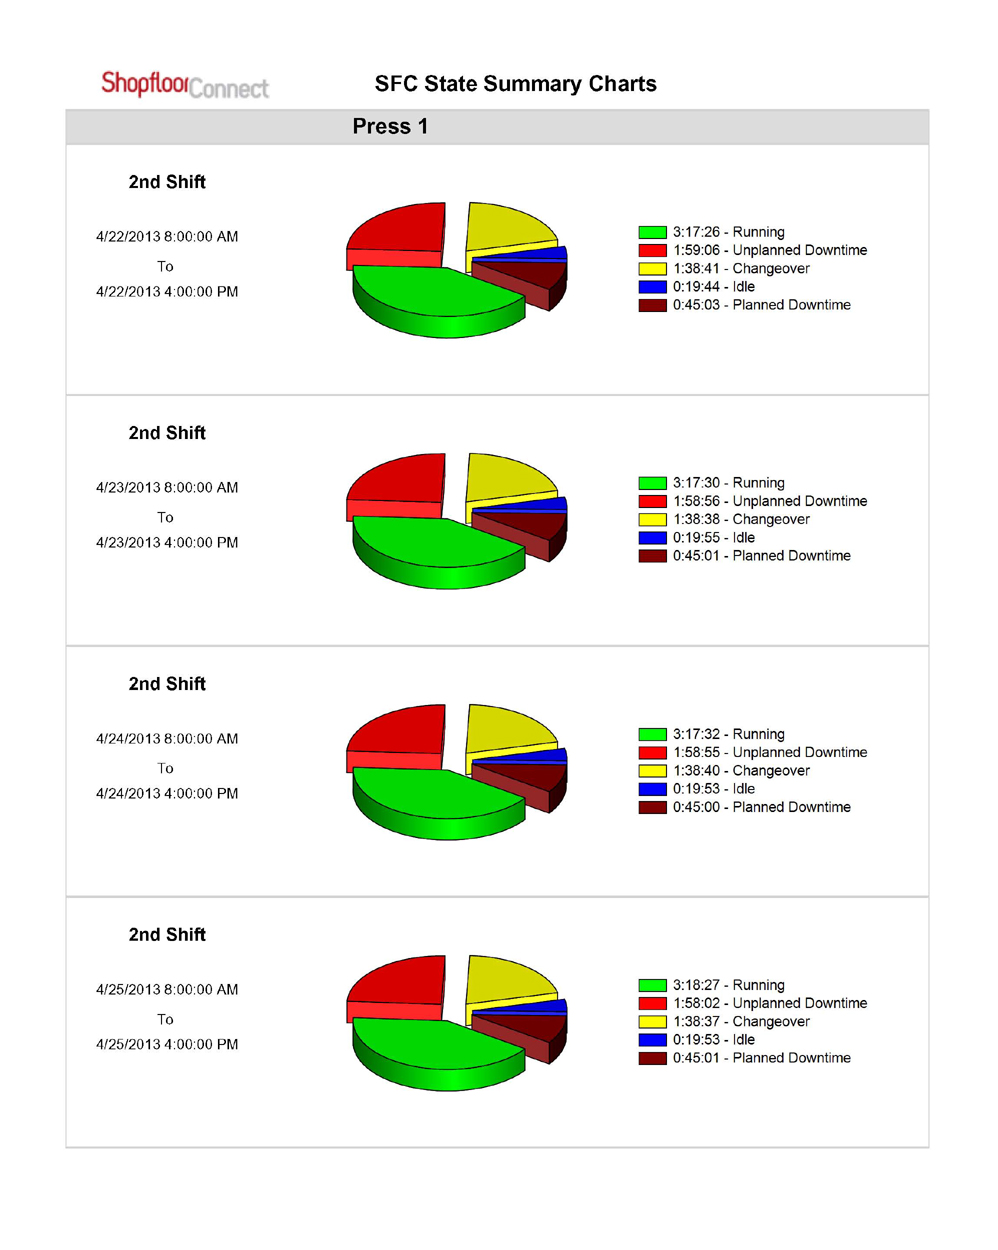
Event Log Report
The Event Log Report is a table that shows a time stamped list of every event that occurs at the machine, along with the operator number, primary item, and duration for each event.
This machine monitoring report features the standard ShopFloorConnect filters, as well as a filter that allows you to exclude selected machine states and status messages. By excluding everything but the unplanned downtime, you can produce a detailed list of all of your downtime events for specified time period.
Sample Event Log Report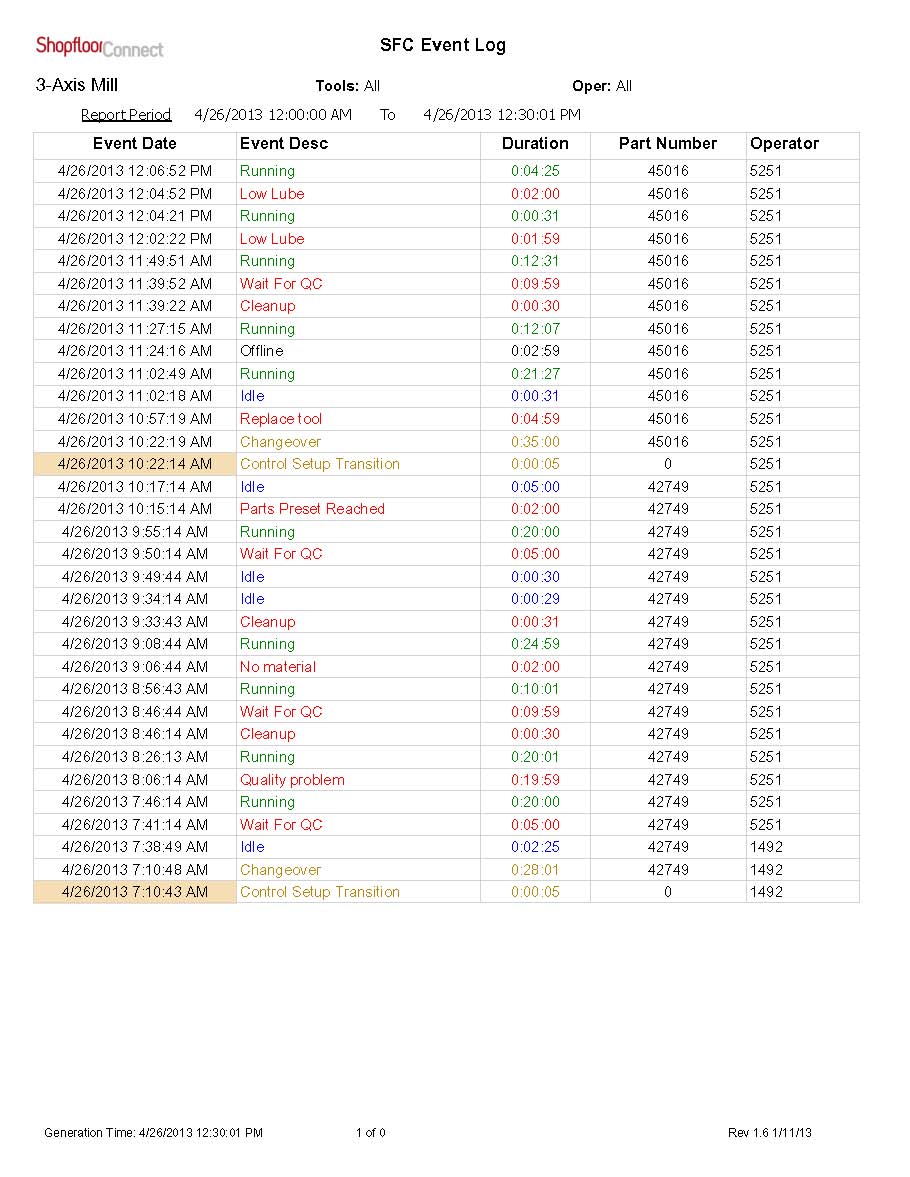
Track Cycles Report
ShopFloorConnect has the ability to track the number of cycles on maintenance items that are used in the machine(s), but that do not necessarily cycle 1-to-1 with any single machine; such as when you have a series of metal forming dies each of which can run in any one of 5 machines depending on demand for parts. ShopFloorConnect can separately keep track of the number of cycles on each forming die, regardless of which machine runs it. ShopFloorConnect also allows you to set a maintenance preset for each tracked item.
The Track Cycles report features the standard ShopFloorConnect delivery filters, as well as a filter that allows you to select whether to include only the tracked items that have exceeded their cycles preset, or those that have either exceeded or are within a specified percentage of the preset. machine states and status messages. There is also a filter to specify how the report is sorted (by item number, description, or percent of preset).
The Track Cycles Report is typically automatically delivered on a set schedule to the personnel responsible for maintaining the tracked items.
Sample Track Cycles Report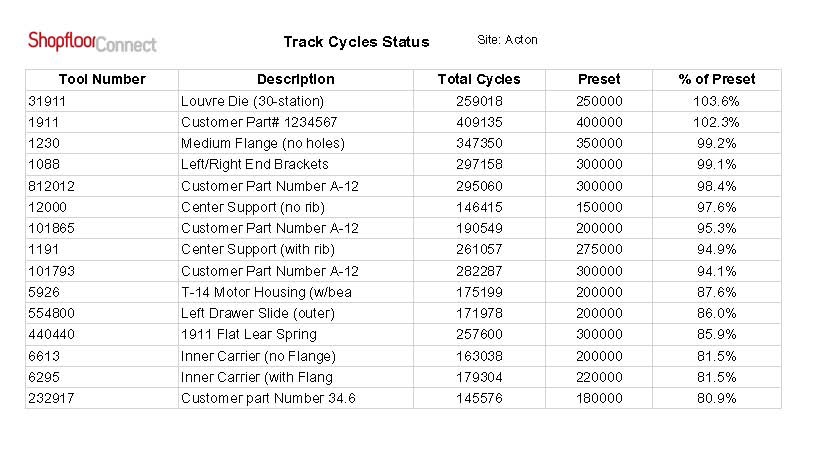
Download our whitepaper to learn more or contact ShopFloorConnect to schedule a demo or for more information.